
Useful Business Dashboards Start with Clear Decisions
Choose the metrics, definitions, data sources, and actions the team actually needs.

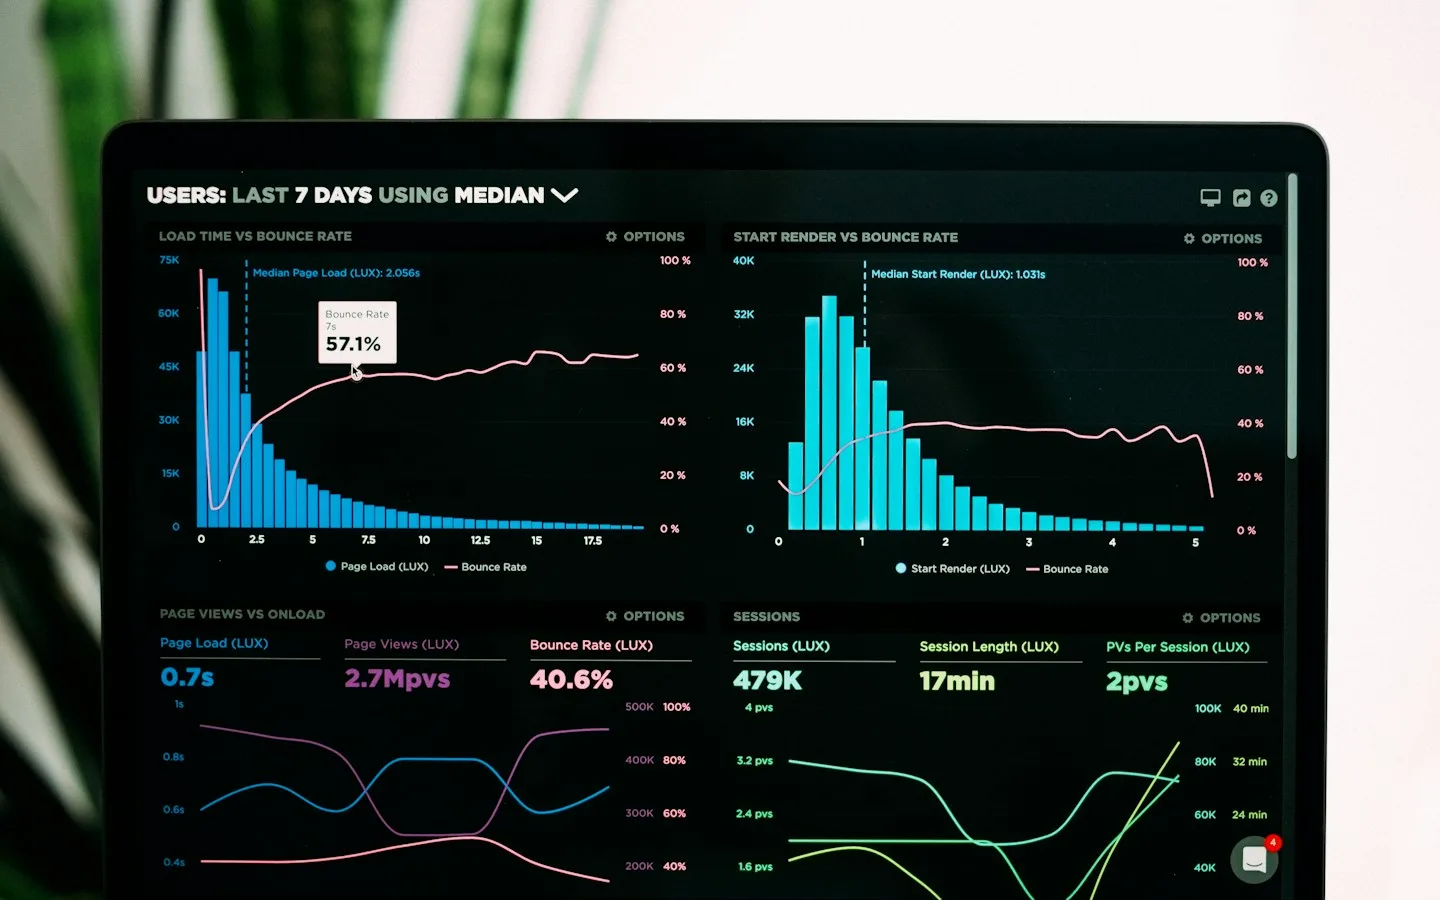
A dashboard full of charts can look sophisticated without answering an owner’s questions. Are orders late? Which products need replenishing? Why do branch reports disagree? A useful dashboard begins with decisions like these, then chooses the records and visual presentation that help someone act with enough context. More charts are not automatically more insight.
The key takeaways
- Start with users and decisions, not a chart list.
- Define each metric, period, and data source.
- Provide access to detail and explain data limitations.
01Ask what decision needs to be made
Ask users about daily and weekly decisions. An owner may need a sales overview while operational staff need a list of orders requiring attention. They do not necessarily need the same page or level of detail.
Write down the possible action for each requirement. A number without decision value or context may belong in a separate report. The main dashboard should provide direction instead of displaying every record that happens to be available.
02Agree on metric definitions
Sales might mean orders created, payments received, or goods shipped. Distinguish gross amounts, cancellations, returns, and pending values. Without shared definitions, two correctly calculated charts can still communicate different things.
Record the source, calculation, refresh timing, and owner. Explain date ranges and relevant time zones. When comparing branches or periods, make sure coverage is reasonably comparable and do not hide important differences.
03Choose a presentation that answers the question
Use summaries for quick status, trends for changes over time, and tables for detailed inspection. Not everything needs a chart. A list of late orders with action links may help more than a graphic showing only how many are late.
Provide readable labels, units, and explanations. Do not rely only on color for important states. Check mobile behavior and whether the information can be understood without hovering over every point.
04Show freshness and data problems
Distinguish zero, missing data, loading failure, and stale information. Those states do not mean the same thing. Show appropriate refresh information so decisions are not based on a misunderstood value.
For multiple data sources, examine synchronization delays and duplicate records. Provide a route back to the underlying transactions. When reports disagree, people need to inspect their periods and constituent records, not just exchange chart screenshots.
05Test real tasks and permissions
Ask intended users to answer work questions with the dashboard. Observe whether they find the right information and understand the next step. Check date filters, exports, empty states, and detail lookup beyond the presentation sample.
Limit records according to responsibilities and enforce access in the system. Financial reports, customer information, and branch records may not be appropriate for everyone. Revisit the dashboard as business processes change so the measures remain useful.
06Illustrative example: conflicting order reports
An owner sees different sales figures in a dashboard and an administrative report. One counts orders created, the other orders paid, but both use the same label. Before changing charts or calculations, the team needs to agree on the question each number answers.
Definitions distinguish requests, payments, cancellations, and the selected period. The dashboard offers summaries and a route to underlying records. Staff answer real questions, such as which orders need action, rather than checking only chart colors. Stale information is also identified.
Reports are then compared on the same basis. Remaining discrepancies are traced through sources and record changes. This connects design to information quality instead of using a more attractive chart to obscure unresolved metric definitions.
Implementation checklist
- List users and the decisions to support.
- Document calculations, periods, sources, and refresh timing.
- Distinguish zero, missing, failed, and stale data.
- Test details, export, filters, and permissions.
Common questions
Does everything need real-time updates?
No. Match update timing to decision needs and source capabilities. Clearly scheduled updates can suit some reports, while immediate operational tasks may require fresher information.
Why might a dashboard differ from a spreadsheet?
Check definitions, periods, time zones, canceled transactions, and synchronization timing. A discrepancy can reflect different coverage or rules rather than an arithmetic error.
References & further reading
CHARDEN’s editorial guidance includes the following references for further technical reading. Business examples are illustrative.
Guides to websites, applications, and design to help business owners understand their digital options.
Updated